Forecast Accuracy Calculation
We are frequently asked "How accurate are your forecasts?"
We think this question is misguided because it places emphasis on impossible and undesirable (hyper-accuracy is incompatible with maximizing sales) over the helpful—showing you how to maximize sales. This example and the downloadable spreadsheet below highlight the realistic limits to accuracy.
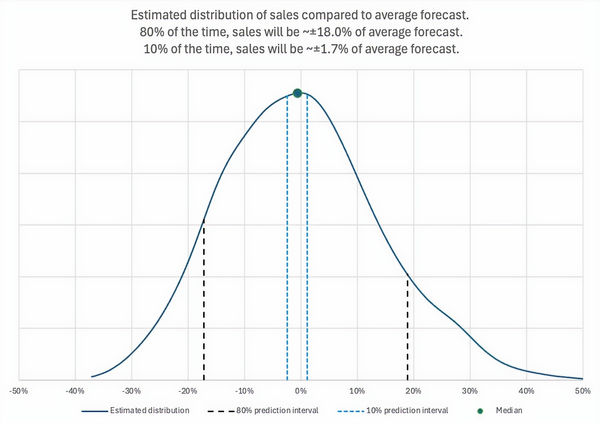
Picture a sales team staring at their pipeline: 250 deals with close dates in the current quarter. They’re wondering what their quarter-end numbers will look like. We can use Monte Carlo simulations to understand the relative likelihoods of possible futures. Here is a sample Monte Carlo simulation showing the distribution of possible outcomes (based on 250 realistic deal sizes and estimated probabilities).

The Problem
With a 250 deal pipeline, there are 2²⁵⁰ (that’s ~1.8×10⁷⁵) possible outcomes. Impossibly large. If you try to forecast by making won/not won calls on each deal (as you do with a Commit list), you’re trying to identify the one out of 1.8×10⁷⁵ possible outcomes. Your chance of getting that right is effectively zero.
The Solution
A better approach is to use a Monte Carlo simulation to estimate the likelihood (y-axis) of different sales outcomes (x-axis). We are interested in the accuracy here, so instead of showing the outcomes in dollars, we’ve normalized them to show the deviation from the mean (average) of all outcomes. That’s the zero point on the x-axis.
Here's where it gets interesting: in this example above, 80% of the time, actual sales will land within ~17.9% of that average forecast. But there's more drama. How likely is a hyper-accurate forecast? The blue lines show that you will land within ~1.7% of the average forecast only 10% of the time.
These figures of course apply to the sample dataset that we used here. Your results will be different. The distribution is heavily influenced by the number of deals in your pipeline and the concentration of deal sizes. Fewer deals and more disparate deal sizes make for wider distributions.
The Moral
If you’re obsessed with hyper-accurate forecasts, you’ll be disappointed most of the time. You may get lucky and land very close to your forecast. But consistently doing that is not possible with this sample pipeline—and with most real pipelines, unless you have massive transactional volume.
The sample distribution shows the folly of chasing perfect predictions*. A Monte Carlo simulation can help you understand the relative likelihoods of different outcomes. More important, usually the x-axis is in dollars as in the example below. You can use the distribution to make more meaningful and informative forecasts.
For instance, the dark blue vertical line in the figure below indicates that there is a 90% chance of exceeding $2.13M. This is a much more powerful way to present a forecast compared to a single number or a single number bracketed by low and high figures— particularly when the forecast is not normally distributed.

Download the Excel Monte Carlo simulator to explore tailored scenarios (using this realistic sample data) that are closer in size to your pipeline. Contact us for a workbook where you can see this on your data, or to try Funnelcast.
Next Steps
If hyper-accurate forecasts are unrealistic, what’s the point? Your sales are not like the weather. You can change the outcome. A good forecast model quantifies the effects of changes in inputs and helps you maximize sales.
Instead of chasing hyper-accurate forecasts, we recommend that you:
-
Accept that there is uncertainty you can’t control.
-
Focus on the factors that you can control and that affect your sales.
-
Understand those effects and identify the most impactful changes you can make.
If you do those things, instead of exactly hitting your initial forecast, you’ll be beating it.
______
*The example shows this clearly, and it does not reflect other variability sources:
-
Sales from deals not in the pipeline or not expected to close in the forecast period.
-
Changes in deal amounts between when you make the forecast and deals closing.
-
Errors in the estimated probabilities of each deal.
