
Conversion Rate Conundrums
- Bill Kantor

- Jan 21
- 4 min read
Updated: 3 days ago
This is part one of a two part post. See More Conversion Rate Conundrums for the complete analysis.
Stage-to-stage sales conversion rate models are a popular way to forecast and optimize sales processes. Although easy to grasp, they nearly always produce misguiding results. Time-til-won models are simpler, better, and more actionable.
Conversion rate models predict your sales based on additions to your pipeline and stage-to-stage conversion rates. Here’s a business with five stages leading to “closed won" and with conversion rates (CR) between stages.

If you add new opportunities to the pipeline, the model estimates how many would pass through each stage as they mature through the process. Just multiply the deal count in each stage by its conversion rate to get the next stage’s total.
The real example below is based on actual measured conversion rates. [1]

Of 586 new deals, the sequential stage-progression model predicts just seven wins—but the business actually closed 89—using the same data that was used to create those conversion rates. That’s because sequential stage-progression oversimplifies reality. Deals skip or revisit stages, and some start mid-pipeline.
To see what's happening, we can rearrange the sales process as a “from stage” and "to stage" transition matrix. This shows all the possible movements—not just the ones that went sequentially from each stage to the next. [2, 3]
A transition matrix shows the true flow. Of those 586 deals that were started, 327 (56%) moved to Stage 1 (conforming to the model). But 81 skipped ahead to Stage 2, eight jumped to Stage 3, etc. These “non-conforming” transitions don’t fit a sequential stage-to-stage model.

Only 8% of the 2,217 transitions are “non-conforming,” yet they cause a big discrepancy. The sequential progression model predicts just a 1.2% overall win rate, but the actual rate is 15%. The matrix shows why. There are many paths to “Won” other than sequential progression, making stage-to-stage conversion the wrong model for this data. These models only work under ideal conditions.
The aim of any model is to predict and help you increase wins. But stage-to-stage models focus on conversion rates, when you really care about win rates and timing. For instance, applied to the data above, the conversion-rate model will under-forecast wins and tell you nothing about when deals will close. (See our blog More Conversion Rate Conundrums for a discussion on incorporating timing in conversion models.) If used for resource allocation, it will drive you to overstaff for demand generation and understaff for later stages.
This 8% non-conforming transitions example is an outlier in our experience. Here’s another dataset with a more typical 31% non-conforming. In this case the prediction error is even more stark.

To fix this, you’ll need to invent data to fit the model by artificially filling skipped transitions and handling [4] out of order cases—tricky in spreadsheets.
Businesses try to optimize sales by increasing conversion rates. The model seems like a good way to understand these effects. But conversion rates are not independent. In reality, early-stage increases often reduce later-stage conversion rates and no one knows the interdependencies. Moreover, increasing early stage conversions can reduce sales and increase costs by gumming up the pipeline with un-winnable deals.
Finally, conversion rate models ignore how long deals take to close. That’s fine if timing doesn’t matter. Conversion rate models only predict an “eventual” outcome. [5]
In summary, the constraints to using a conversion rate model are:
Sequential stage progression
Independence of conversion rates
You don’t care about timing
If those constraints aren’t met, use a model that fits your data, rather than inventing data to fit the model. Time-til-won models of win rates by stage are the way to roll.
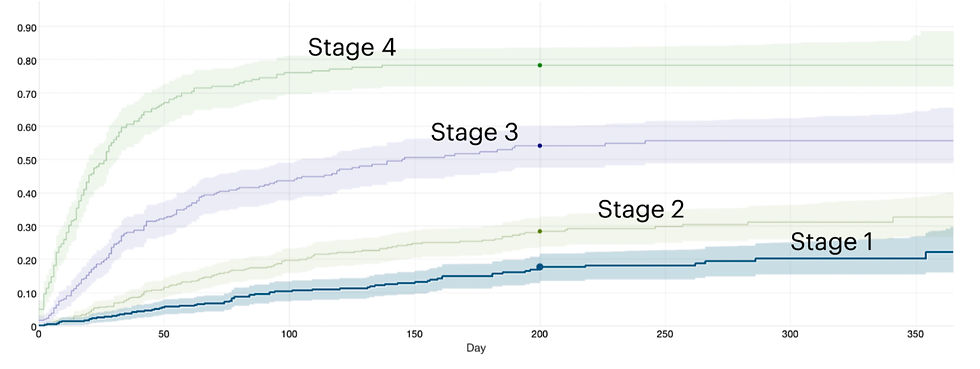
Here’s what that looks like. Each line is a stage in your a process. For instance, 200 days after entering Stage 1, about 17% of deals are closed-won.
A time-til-won by stage model:
Admits non-sequential progression—deals can start or go anywhere.
Focuses on what really matters: wins (no messy stage-to-stage conversion dependencies).
Bakes in timing, so you can forecast for any timeframe.
Supports forecasting, planning, and optimization.
Want to build one? Check out our blog for detailed instructions, or contact us to learn how you can optimize sales with a Funnelcast time-til-won model.
Editor's Note (Late February 2025):
Adding this in response to reader questions about incorporating time to work around constraint 3. People suggested adding "delta T" between stages or using the overall sales cycle. Neither of these work well. See More Conversion Rate Conundrums for details.
Measured for new business opportunities created over a one year period. Transitions were observed over two years. The business has an average sales cycle of ~120 days.
Stage transitions exclude updates to the opportunity record in which the sales stage was unchanged.
If you are building a transition matrix, you may want to further filter data (a) to include only data from the distant past so that every deal has had ample opportunity to transition and resolve to won or lost (in process deals can have similar effects to non-conforming transitions), (b) to eliminate intra-day transitions (these are usually mistakes that get corrected by the end of day), (c) to reflect only one transition into each stage per opportunity.
Filling missing data for skipped stages or starting in the middle is straightforward, but tricky to implement. Stage reversals are a bigger problem. I don't think this is fixable. Maybe hope you don't have a lot of these and that the effect is minimal. Better yet, use a Time-Til-Won model.
Measuring conversion rates in a short period does not solve this problem. It just increases the volatility in the conversion rate measurement which is a long term. And transitions are additive. Nor does applying the average sales cycle to the prediction—you would be applying long-term conversion rates to an average sales cycle. Moreover, you would want to understand the distribution of possible outcomes rather than the average expectation.
Comments