
There’s an easier way that helps you sell more.
CRM systems have three primary opportunity fields vital to understanding deal health: Sales Stage, Amount, and Close Date. Each field conveys independent information about the status, potential value, and timing of an opportunity. But CRM systems have another field, Forecast Category, not independent from Close Date (timing) or Stage that can muddle the picture.
Why use this field? Companies try to use Forecast Category to:
Make accurate forecasts based on rollups (summing the Amounts) of deals classified as Commit and possibly Best Case.
Focus attention and resources on opportunities classified as Commit with the intent of maximizing sales.
The question every company using Forecast Category should ask: does their use of Forecast Category achieve those objectives?
The answer—illustrated in this note for real-world companies—is that it does not. Perversely, use of Forecast Category can hinder forecasting and sales maximization.
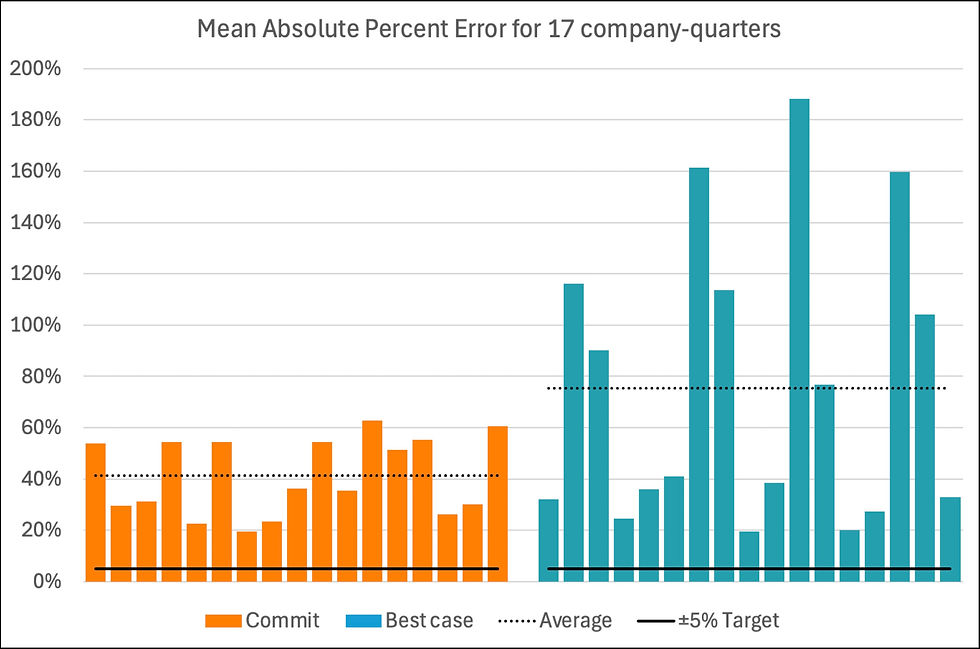
1. Accurate forecasts?

Commit and Best Case rollups are inaccurate and chaotic as shown above. Out of 17 different companies and quarters, Commit and Best Case Rollups were within ± 5% of the total won in the quarter only 10% of the time. Even in the last two weeks of the quarters, Commits were within ± 5% of total won only 38% of the time! [1]
Forecast Category is often at cross-purposes with Stage and Close Date. For instance, a Forecast Category of "Commit" with a low stage; or high-stage deals with Close Dates in-quarter but not in Commit or even Best Case. Mixed signals are confusing.
Management opinions (forecast "calls")— low/mid/high estimates—attempt to rein in the chaos and to incorporate prospective deals that are not in the pipeline yet. Judgment may provide better guidance, but is often arrived at in a non-repeatable, ad hoc way.
Most CRM analytics tools simply streamline this ineffective process (duplicating capabilities included by default in Salesforce, HubSpot…).
Distributions: the alternative to rollups and forecast “calls”
It’s unrealistic to try to predict the outcome of every deal in a pipeline. There are over 1000000000000000 possible outcomes from a pipeline with only 50 deals! Commit is a subset of deals with high certainty—and therefore a small portion of total sales. Forecast "calls" based on Forecast Category rollups are necessarily largely made up.
A forecast distribution clearly shows the relative chances of all possible outcomes. It's easy to estimate [2] for both existing pipeline and prospective new pipeline. Instead of making a forecast “call” based on rollups, show the distribution to your stakeholders. If you want near certainty, look at the left side of the blue shaded area—with an estimated 9 in 10 chance of beating that number. Even better, distributions allow you to visualize the effect of changes. The blue curve projects business as usual; beige shows the impact of advancing Focus deals (more below) and boosting demand gen.

2. Focus ranking: the alternative to Commits lists for maximizing sales
Unless you win every deal and have more resources than you have deals to work, focus matters. Commits lists are conservative—the deals highly likely to close. But they don’t maximize your sales. You can do better.
Focus ranking uses a technique called the efficient frontier to systematically build optimized portfolios of deals that maximize sales for a user-selectable risk level. The efficient frontier is a proven, Nobel-prize-winning technique used in computational finance to maximize returns for a given level of risk. We simply adapted this idea to maximize sales.

We extensively compared Commit lists with same-sized Focus rankings for five companies over six quarters, week-by-week. Focus produced on average 58% more sales.
Using Focus is simple. It’s a burn-down list. Work down the list using your judgment, and do your best to advance your cause for each deal. Reviewing the Focus guarantees that you've done your best to maximize sales every day. And you will do your best tomorrow. You will sell more.
Want to learn more?
Conclusion
Forecast Category and late sales-stage [3] rollups have been the standard approach to sales forecasting for years. Commits may be reasonable indicators for individual deals. But they don’t work for forecasts because they are short-term signals and only predict a small portion of total sales. More important, focusing resources on deals in Commit is harmful—it does not maximize sales.
Most RevTech vendors simply streamline the submission and rollup process—a process that is not accurate and harmful. Your time is better spent focusing on what you really care about—maximizing sales.
Our recommendation:
Abandon Forecast Category and rollups. They’re not accurate and don't maximize sales.
Disciplined use of your sales methodology and updating deal Stages, Close Dates, and Amounts.
Redirect the time that goes into rollup forecast submissions to selling.
Report forecast distributions instead of forecast rollups and made up “calls.”
Focus on an optimal ranking of deals that maximizes your expected sales.
Funnelcast provides state-of-the-art implementations for all of these ideas. You can do many of these things on your own following extensive documentation on our blog. Or you can use Funnelcast. You’ll get:
Automated forecast distributions for existing and prospective new pipelines, current month to next year.
A daily Focus ranking that’s 60% better than your Commit lists showing you which deals to work so you maximize your expected sales.
Similar impact-based ranking of demand generation by business segment so you maximize sales.
[1] A more detailed analysis of prediction accuracy is to compute the mean absolute percent error (MAPE). MAPE is the average of the daily absolute forecast errors in percent.
MAPE = (1/n) × Σ(|Actual - Forecast| / |Actual|) × 100.
Where:
n = number of observations
Actual = the actual sales
Forecast = the predicted sales
Σ = summation across all observations
MAPE is computed below for each company-quarter shown in the first figure above.
[2] Provided that you have reasonable probabilities, filter out or de-weight stale deals, and have not muddled the picture by using Forecast Category at cross purposes with Stage or Close Date. Or, just contact us. Funnelcast takes care of all of these. See our blog on how to compute empirical probabilities.
[3] Late sales-stage rollups are very similar to Forecast Category rollups. Many businesses automatically set the last stage(s) to Commit.
Comments